If you’re viewing this document, you’ve likely encountered some sort of Javascript issue. Go through the step-by-step guide below to find out the error and go for a solution.
Why Detecting Them Is Useful? #
Checking these errors will be one of the first things technical support will work on.
So, even if you are not tech-savvy, following these steps can be useful as you will retrieve valuable information that can result in quickly fixing eventual issues.
Debugging: Step by Step #
These steps should be taken in strict order. Make sure to take note of all results.
Test Different Browsers #
To begin isolating the problem, try different browsers – Chrome, Safari, Internet Explorer, Edge, Mozilla Firefox, etc.
If the problem happens only with certain browsers, it’s likely there is a compatibility issue. However, if all browsers present the error, another underlying issue exists.
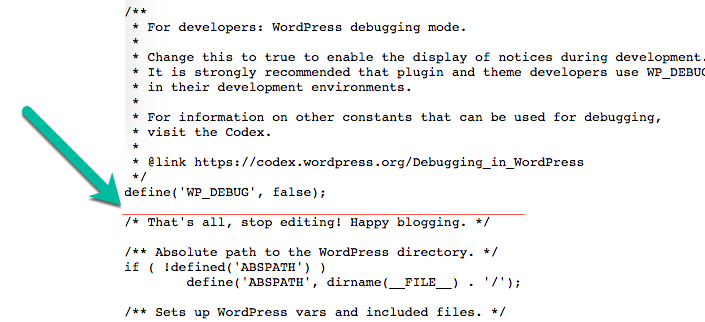
Enable SCRIPT_DEBUG #
Script Debug is a feature that forces WordPress to use the complete versions of some core CSS and JavaScript files rather than the minified versions that are normally loaded. More information on script debugging.
To enable it, open the wp-config.php and add the following line before “That’s all, stop editing! Happy blogging”, as highlighted define('SCRIPT_DEBUG', true);
Now, refresh WordPress and check if the problem persists.
Diagnosis #
Every browser has a feature that shows the error console, in which you can find more specific information about JavaScript. An example of an error as reported in the Chrome Console:

Each error console has a slightly different interface, and the way to activate it also changes. Learn more about each:
- Chrome Error Console
- Firefox Web Console
- Internet Explorer Debugging Script
- Safari Develop Menu
- Opera Error Console
Copy this information. It should include the error, its location, and its context.
Report #
Combine all the information that you have gathered and present it. The more complete it is, the more you will assist the technical support.
